How to Build a Smart Business Dashboard with AI
Do you struggle to interpret scattered business data? Want a centralized, intelligent dashboard that turns raw data into actionable insights? If yes, then you’re in the right place. A smart business dashboard with AI can transform how you view and act on your data. Instead of juggling spreadsheets, guessing trends, or reacting to problems late; you can see predictive insights, performance automations, and real‑time KPIs at a glance.
Whether you’re a small business owner or a marketing manager, building an AI‑powered dashboard lets you make confident decisions backed by data; not intuition. In this article, I’ll walk you through exactly how to build a smart business dashboard with AI, step by step.
We’ll explore what it is, why it matters, key components, tools to use, a sample implementation plan, a comparison table, and commonly searched questions related to this topic. Let’s get started.
What Is a Smart Business Dashboard with AI?
A smart business dashboard is a digital interface that displays your most important metrics (KPIs), visualizations, and insights; all in one place. When you integrate artificial intelligence into it, the dashboard can do more than show numbers: it can…
✔ Predict trends and anomalies
✔ Recommend actions
✔ Automate alerts
✔ Highlight patterns humans might miss
✔ Personalize insights based on user behavior
Instead of manual analysis, AI uses machine learning and algorithms to automate analysis and forecasting. This makes dashboards not just informative but intelligent.
Read more: How Generative AI Improves Customer Personalization
Why AI Is Essential for Modern Dashboards
Traditionally, dashboards were static charts and tables that showed historical data. But today’s business environment moves too fast for that. AI brings:
🔹 Predictive Analytics
Forecast future performance based on past patterns.
🔹 Anomaly Detection
Automatically flags unusual trends like a sudden drop in sales.
🔹 Contextual Insights
Provides explanations for why numbers are rising or falling.
🔹 Automated Alerts
Notifies teams when predefined thresholds are met.
🔹 Natural Language Queries
Let’s you ask questions like “Why did revenue dip last week?” and get answers.
In a world filled with data from tools like Google Analytics, CRM systems, social media platforms, and e‑commerce stores, an AI dashboard becomes the bridge between raw data and strategic decisions.
Key Components of an AI‑Powered Business Dashboard
A typical AI business dashboard includes:
Data Sources
Systems that feed data into your dashboard, such as:
- CRM (e.g., Salesforce, HubSpot)
- Financial software (e.g., QuickBooks)
- Web analytics (e.g., Google Analytics)
- Social media metrics
- Customer support systems
KPIs & Metrics
Quantifiable measures that track performance, such as:
- Revenue growth
- Sales conversion rates
- Customer retention
- Average order value
- Website traffic
Visualizations
Charts, graphs, gauges, heatmaps, and tables that make data easy to understand.
AI Modules
Machine learning models that provide predictions, detect patterns, and generate recommendations.
Alerts & Actions
Notifications and task automation when certain conditions are met.
Step‑by‑Step Guide: Build a Smart Business Dashboard with AI
Here’s how you can build your own intelligent dashboard even with limited technical experience.
Step 1: Define Your Goals
Before building anything, ask:
👉 What business questions do you want answered?
👉 What decisions will this dashboard help you make?
Example goals:
✔ Monitor weekly sales performance
✔ Predict monthly revenue
✔ Detect anomalies in customer churn
When your goals are clear, you can determine what data to collect and which KPIs matter most.
Step 2: Identify Data Sources
Collecting quality data is essential. Typical sources include:
- CRM data: customer behavior, sales pipeline
- Sales data: transactions, revenue
- Website analytics: visits, bounce rate
- Marketing tools: campaign performance
- Customer service data: response times, satisfaction scores
Organize these data sources so they can flow into your dashboard usually via APIs, connectors, or data warehouses.
Step 3: Choose Your Dashboard Tool
Here are some popular tools that support AI analytics and dashboard building:
| Tool | AI Capabilities | Best For |
|---|---|---|
| Microsoft Power BI | AI insights, auto anomaly detection | Business intelligence |
| Tableau | Predictive forecasting & natural language queries | Advanced analytics |
| Google Data Studio (Looker Studio) | Integrations with Google analytics, AI plugins | Easy reporting |
| Qlik Sense | Machine learning and smart visualizations | Interactive dashboards |
| Zoho Analytics | AI assistant, forecasting | Small business analytics |
| Domo | Real‑time alerts + predictive analytics | Enterprise cloud |
| Metabase + AI plugins | Open‑source with machine learning support | Custom dashboards |
Step 4: Clean and Integrate Your Data
No AI dashboard can function well if the data quality is poor.
✔ Remove duplicates and errors
✔ Standardize formats (dates, numbers, categories)
✔ Align data from different sources
You may use a data warehouse (e.g., Amazon Redshift, Google BigQuery) or ETL tools like Talend or Fivetran to centralize and transform your data before feeding it to your dashboard tool.
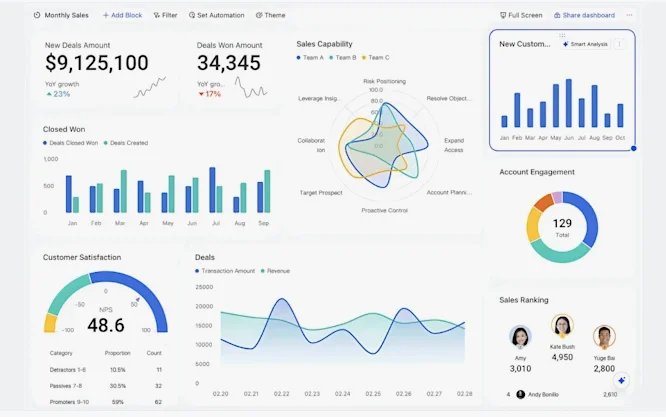
Step 5: Build Your Dashboard Layout
A good dashboard is clear, focused, and actionable. Remember:
📌 Place the most important KPIs at the top
📌 Use concise visualizations (graphs, cards, tables)
📌 Group related metrics together
📌 Avoid clutter — less is more
Example layout sections:
✅ Executive Summary
✅ Sales & Revenue Trends
✅ Customer Behavior Insights
✅ Marketing Campaign Performance
✅ Anomalies & Alerts
Step 6: Add AI Modules & Automations
Depending on your tool, add AI functions like:
🔍 Predictive Forecasting – Project future metrics
⚠️ Anomaly Detection – Spot unusual patterns
📈 Trend Analysis – Identify growth or slowdown
🧠 Natural Language Q&A – Generate insights from text questions
Many BI platforms now have built‑in AI capabilities you can enable with one click — for example:
- Tableau’s Ask Data for natural language queries
- Power BI’s Quick Insights and AI visuals
Step 7: Test & Iterate
Once built, continually refine your dashboard:
✔ Validate the accuracy of predictions
✔ Confirm alerts trigger at the right thresholds
✔ Ask users for feedback
✔ Add or remove KPIs based on usefulness
Remember: your dashboard should stay relevant and evolve with your business.
Example: Core Dashboard Metrics
Here’s a simple breakdown of typical dashboard data categories and why they matter:
| Category | Example Metrics | Purpose |
|---|---|---|
| Sales | Revenue, Avg Order Value, Conversion Rate | Track business performance |
| Marketing | Cost per Lead, ROI, Traffic Sources | Measure campaign success |
| Customer | Churn Rate, Lifetime Value | Understand retention & loyalty |
| Operations | Support Tickets, Response Time | Improve internal efficiency |
| Forecasting | Predicted Revenue, Trend Lines | Plan future strategies |
Benefits of an AI Business Dashboard
Here are the biggest advantages you get:
🔹 Real‑Time Decision Making
Instant view of performance instead of waiting for reports.
🔹 Data‑Driven Predictions
AI forecasts trends before they happen.
🔹 Less Manual Reporting
Automatic data updates save time and reduce errors.
🔹 Personalized Insights
AI highlights what matters most based on your business patterns.
🔹 Alert Automation
You’ll know when something needs immediate attention.
FAQs (Frequently Researched Questions)
Q1. What tools are best for non‑technical users?
Platforms like Google Data Studio (Looker Studio) and Zoho Analytics are friendly for beginners. They offer drag & drop interfaces and built‑in AI assistants.
Q2. Is coding required to build an AI dashboard?
Not necessarily. Many tools provide connectors and automated AI features. Coding is only needed for advanced customizations.
Q3. How often should the dashboard be updated?
Preferably in real time. But daily or hourly updates work too based on your business needs.
Q4. Can an AI dashboard predict customer churn?
Yes. With machine learning models and historical data, your dashboard can estimate the likelihood that a customer will churn.
Q5. How do you measure ROI from a dashboard?
Look at metrics like decision speed, accuracy improvements, revenue growth, cost savings from automation, and reduction in manual reporting time.
Final Thoughts
Building a smart business dashboard with AI isn’t just about visualizing numbers: it’s about unlocking insights, automating analysis, and empowering better decision‑making. Whether you’re tracking sales, monitoring marketing performance, understanding customers, or forecasting trends a well‑built AI dashboard becomes your command center for growth.
If you take just one thing from this guide: start with clear goals, choose the right tools, and then let AI turn your data into action.